 |
|
Annual
Statistics
| |
2008 |
2009 |
2010 |
2011 |
2012 |
5 year Avg. |
|
Volunteer hours on incidents, in training, or special events |
7,400 |
6,731 |
7,594 |
6,447 |
7,574 |
7,149 |
| Volunteer hours spent on call |
14,184 |
11,204 |
14,398 |
13,416 |
14,766 |
13,594 |
| Total Incidents |
1,036 |
877 |
907 |
1,100 |
1,088 |
1,002 |
| EMS |
674 |
608 |
608 |
755 |
783 |
686 |
| Fire |
362 |
269 |
299 |
345 |
305 |
316 |
Average EMS response time
(tone to response) |
3:30 sec |
3:43 sec |
3:43 sec |
2:54 sec |
2:35 sec |
3:17 sec |
|
|
|
|
|
|
|
| EMS Calls by Type |
| Medical |
46% |
56% |
47% |
48% |
54% |
50% |
| Trauma |
27% |
28% |
31% |
27% |
25% |
28% |
| Fire standby |
6% |
3% |
3% |
4% |
9% |
5% |
| Cardiac related |
10% |
3% |
9% |
7% |
5% |
7% |
| Mental Health |
4% |
3% |
6% |
7% |
2% |
4% |
| Other |
7% |
4% |
4% |
7% |
5% |
5% |
|
|
|
|
|
|
|
| EMS Calls by Location |
| Yellow Springs |
77% |
72% |
76% |
27% |
75% |
74% |
| Township West |
9% |
9% |
10% |
10% |
8% |
9% |
| Antioch College |
1% |
1% |
1% |
1% |
1% |
1% |
| Township East
|
6% |
6% |
5% |
6% |
7% |
6% |
| Mutual Aid |
3% |
5% |
4% |
7% |
5% |
5% |
| Clifton |
2% |
2% |
2% |
2% |
2% |
2% |
|
John Bryan Park / Glen Helen / Clifton Gorge |
2% |
8% |
2% |
2% |
2% |
3% |
|
|
|
|
|
|
|
| Total Fire Loss |
$241,430 |
$49,750 |
$127,531 |
$936.55 |
$416.70 |
$84,013 |
|
Total Value Saved |
$0 |
$460,537 |
$151,615 |
$4,281.12 |
$4,939.75 |
$124,275 |
|
|
|
|
|
|
|
| Fire Calls by Type |
| Medic Assist |
39% |
32% |
37% |
32% |
37% |
35% |
| False alarm |
11% |
12% |
11% |
12% |
9% |
11% |
| Dispatched & cancelled en route |
7% |
13% |
13% |
11% |
6% |
10% |
| Motor vehicle crash |
8% |
10% |
8% |
6% |
9% |
8% |
| Other incident types |
13% |
22% |
12% |
18% |
22% |
17% |
| Fires |
8% |
8% |
11% |
8% |
6% |
8% |
| Hazardous conditions |
14% |
11% |
8% |
13% |
11% |
11% |
|
|
|
|
|
|
|
| Fire Calls by Location |
| Yellow Springs |
56% |
57% |
59% |
59% |
57% |
58% |
| Antioch College |
0%
|
5%
|
3%
|
8% |
4% |
5% |
| Township West |
13% |
13% |
14% |
11% |
13% |
13% |
| Township East |
10% |
10% |
8% |
9$ |
12% |
10% |
| Clifton |
2% |
3% |
1% |
3% |
3% |
2% |
| Mutual Aid |
6% |
8% |
10% |
7% |
5% |
7% |
| Park / Glen Helen / Gorge |
6% |
4% |
5% |
3% |
6% |
5% |
|
|
|
|
|
|
|
| Fire Calls by Alarm Level |
| First alarm |
60 |
32 |
50 |
63 |
34 |
48 |
| Second alarm |
2 |
1 |
1 |
0 |
1 |
1 |
| Third alarm |
0 |
0 |
0 |
0 |
1 |
0 |
Antioch College was closed at the end of the 2007/2008 school year.
The college reopened for the 2011/2012 school year with 35 students.
|
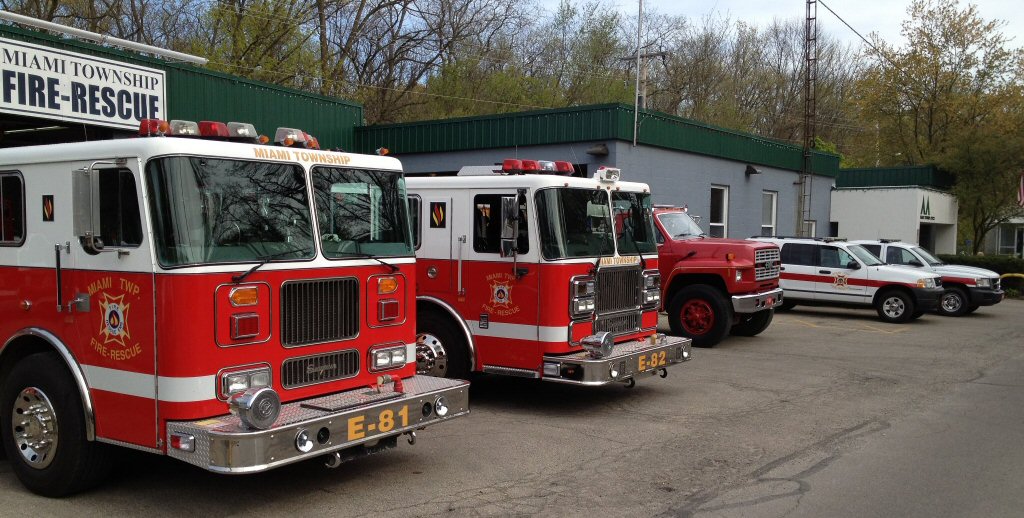
 MIAMI
TOWNSHIP FIRE-RESCUE
MIAMI
TOWNSHIP FIRE-RESCUE